
A primer on FlyWire, a complete connectome of the fly
When does a map become the territory?

FlyWire is one of the biggest, if not the biggest, stories in neuroscience in 2024. The FlyWire collaboration, which included over 100 laboratories, completed a full map of the drosophila brain (“the connectome”–more on what that means later), published its analysis as a dozen papers in Nature, and as a free resource for all to see: the FlyWire codex. It’s a Herculean effort, a triumph of citizen scientists who proofread all 140,000 neurons, and a milestone for neuroscience.
But what does having a complete map of an animal brain give us? In this post, I outline how the FlyWire dataset was collected, what’s in the FlyWire codex, and what it can and can’t tell us about flies. As usual, we’ll get deep in the weeds, and then we’ll back to understand what it all means. I go through each of the papers of the collaboration to highlight how these artifacts are being used, and I’ll highlight some of my favorites from the perspective of systems and computational neuroscience. I ask questions about our ability, as scientists, to understand complex systems, our motivations, and what big neuroscience might look like in the near future.
How to build a map
FlyWire isn’t the first time a big chunk of fly cortex has been mapped: prior to this, the FlyEM hemi-brain connectome had been published in a collaboration between Janelia scientists and Google Brain. But FlyWire was the first effort to map the entire fly brain. Compare the size of the prior efforts to this one:

At a high level, the FlyWire collaboration constructed a map of the fly brain by:

Freezing a drosophila brain
Staining it with heavy metals
Slicing thin slices of the brain
Scanning those slices through serial electron microscopy
Aligning those slices
Using ANNs to (over-)segment the data into supervoxels
Using flood-filling ANNs to then join these supervoxels together into neuron reconstructions
Proofreading the resulting reconstructions by a manual process, reassigning supervoxels to the correct units to obtain clean reconstructions
The electron microscopy dataset has been around since 2018, published in Zheng et al. Reconstruction was no small feat: the dataset contains roughly 100 teravoxels. Tracing these dang neurons is a real challenge.
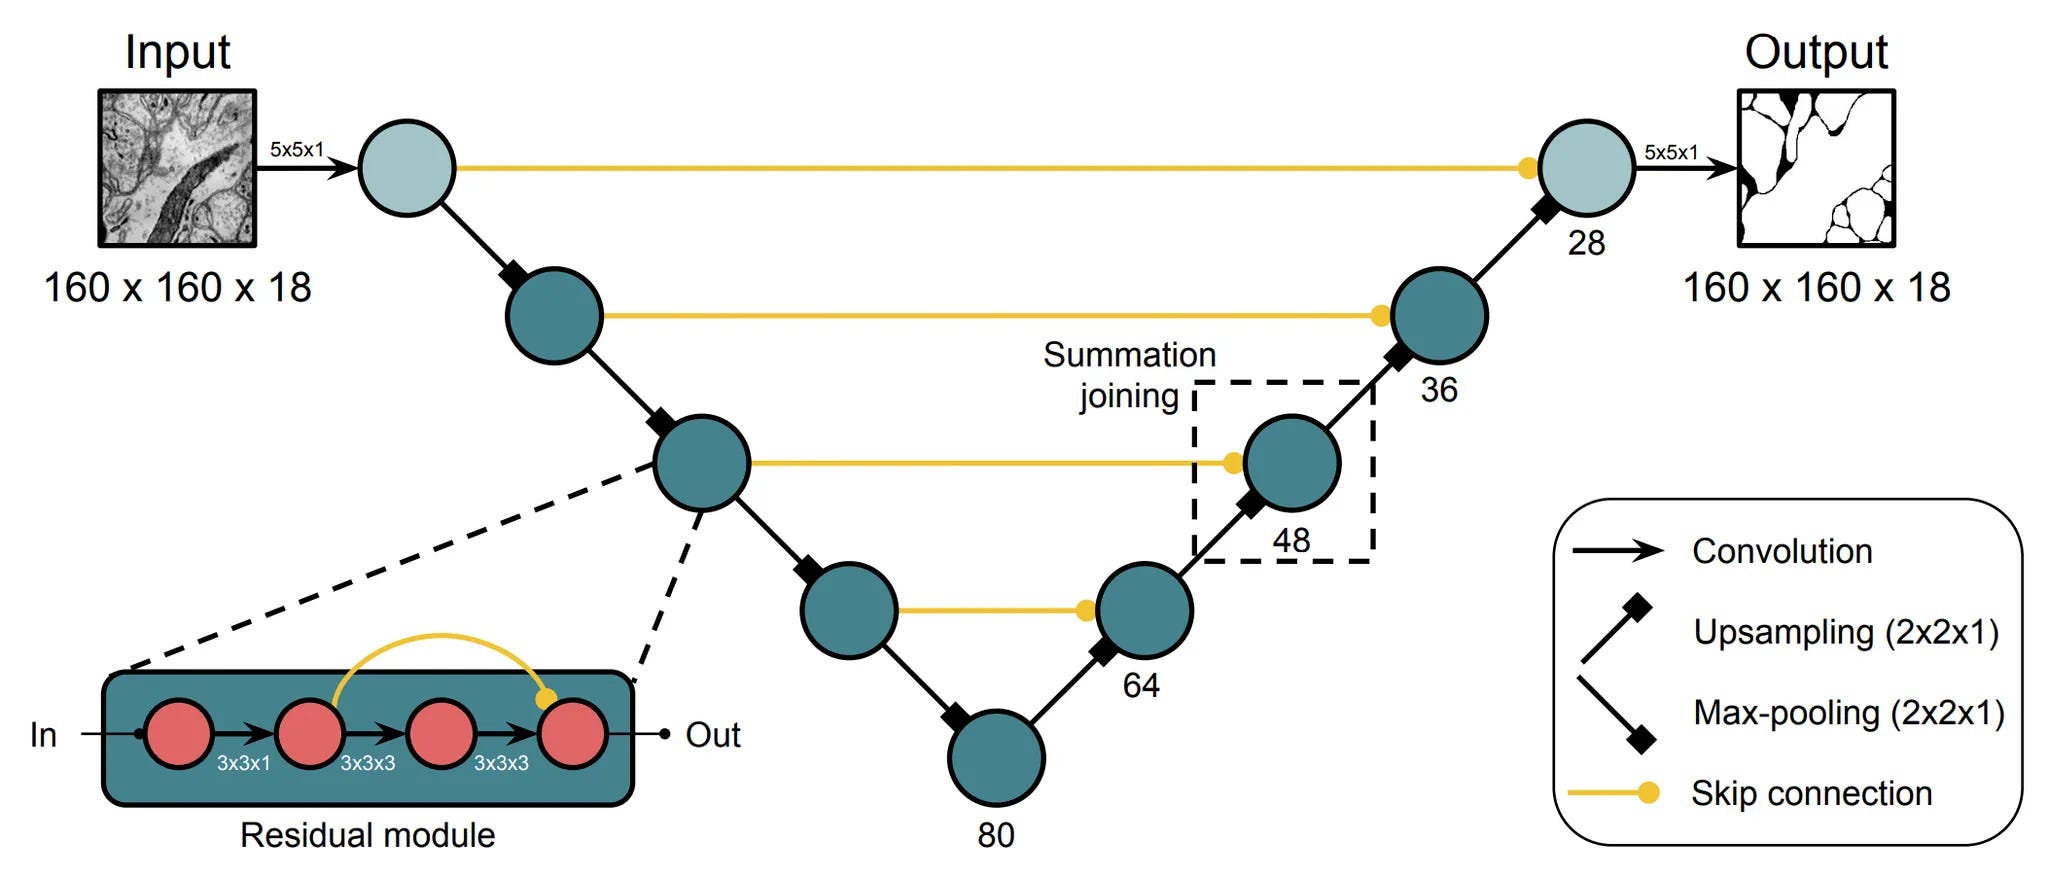
Segmentation and flood-filling are relatively straightforward applications of computer vision, albeit with the challenges associated with scaling. These methods do a first-pass reconstruction, but there are small errors. There are challenges ranging from missing slices to co-fasciculation and invaginations. There’s some non-zero probability of merging the current supervoxel with a wrong sibling–conversely, wrongly splitting two parts of the same neuron–and then the whole reconstruction is incorrect. The tyranny of long-range connectomics is that small error rates accumulate, and the probability of a clean reconstruction goes to 0 over a large volume.

There’s a very significant amount of work in proofreading–merging and splitting reconstructions until clean neurons are obtained. It took about 20 person-years to proofread this dataset, largely with the help of citizen scientists through the FlyWire platform. Here’s an example of a neuron before and after it was proofread (this is a mammalian basket cell, but they used the same CAVE software for proofreading the fly connectome).
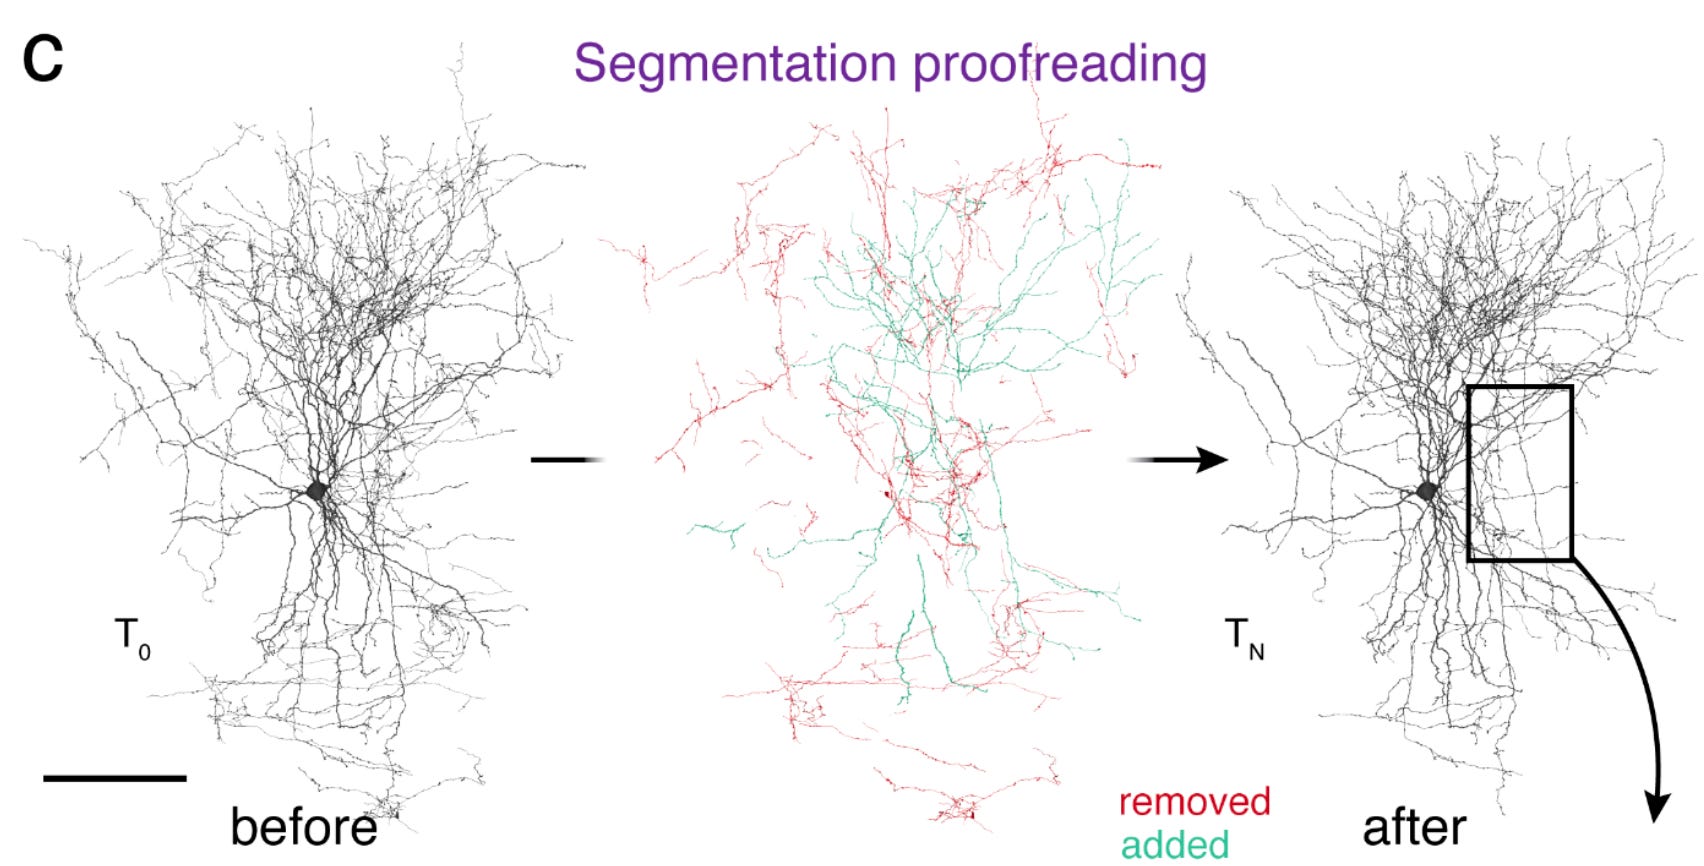
That’s a lot of changes! Fly neurons have simpler morphology than that, but still, errors compound, and they must be tediously corrected. While 20 person-years sounds (and is) a long time, it’s only ~20 minutes for each of the 140k neurons in the fly brain. It adds up! Proofreading is a truly fascinating process of multi-step visual reasoning. I highly recommend watching this video tutorial to get a feel for the process.
Annotating the connectome
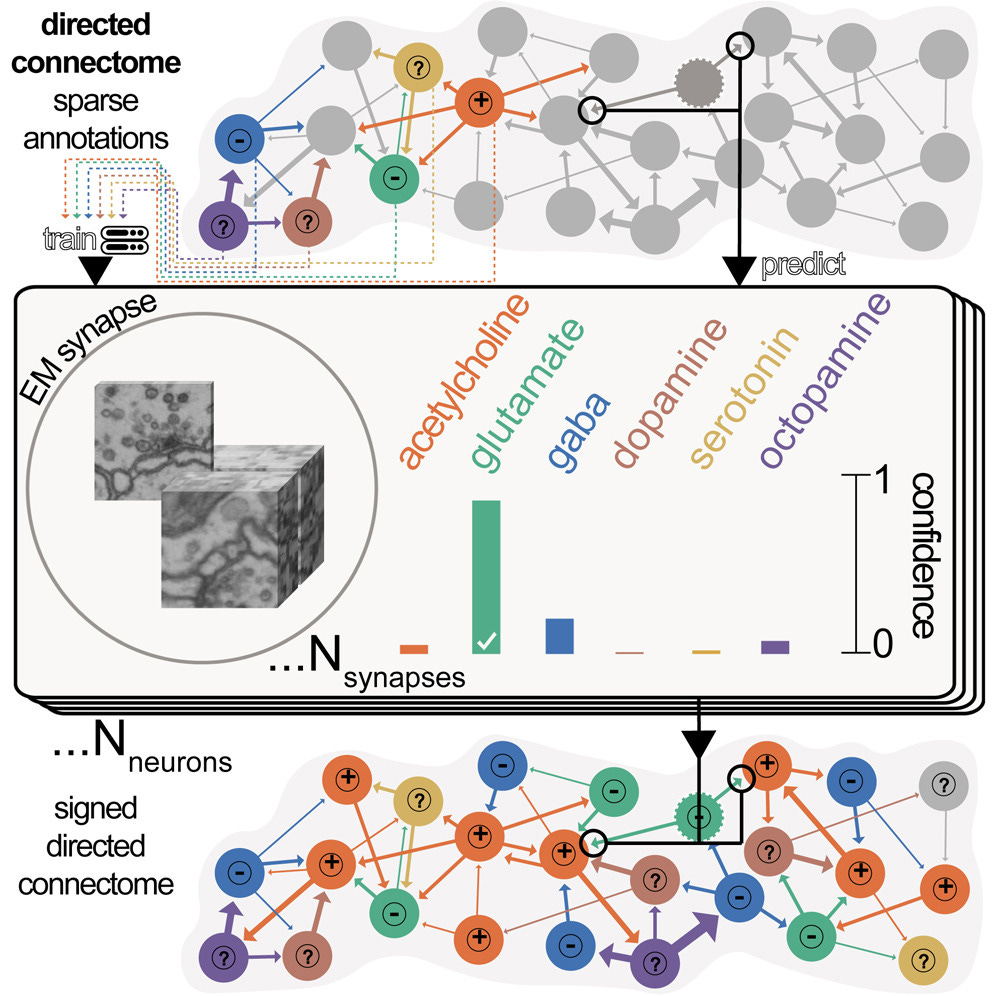
So we’re done, right? Au contraire! There are many annotations left to make. First, we need to detect synapses and determine their type. This was done in Eckstein et al. (2024), using existing known neuron types to come up with sparse annotations, classifying new synapses into one of eight potential neurotransmitter classes, then bubbling up that information to label each neuron’s neurotransmitter class, leveraging Dale’s law.
Then each neuron receives two sets of hierarchical annotations. On the one hand, neurons are classified by flow, superclass, class, and cell type.
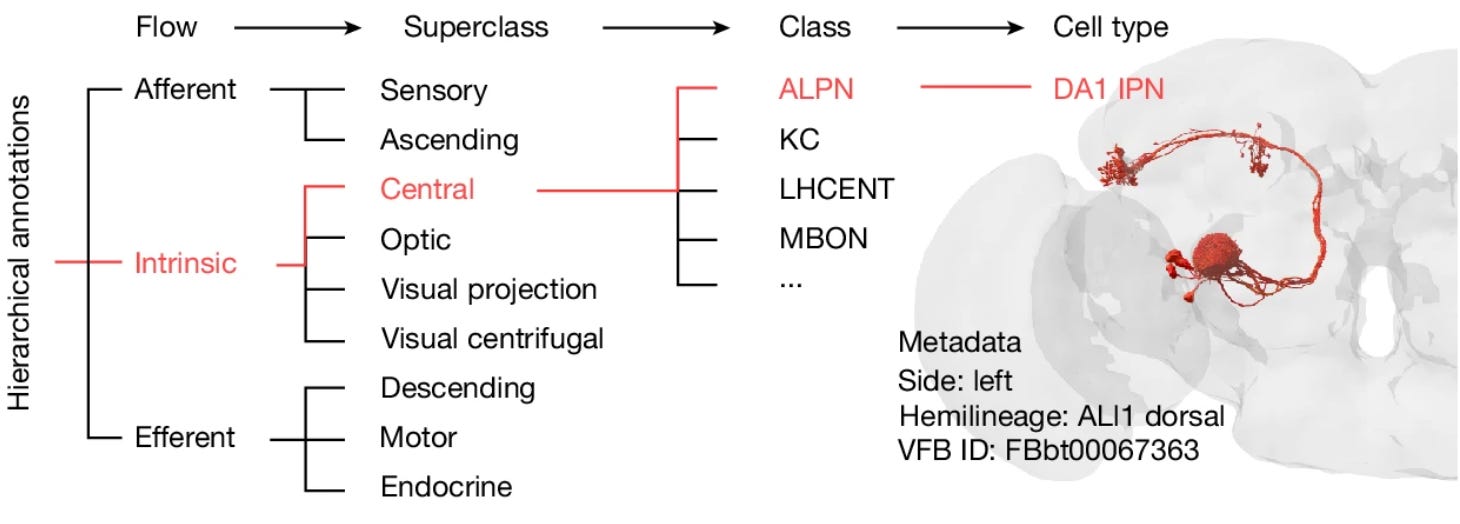
There’s another set of annotations with respect to the developmental origin of the neurons, tracing different cell classes to lineage. The telltale sign that neurons that came from the same hemilineage is that they tend to aggregate in terms of their cell body positions as well as their tracts.

And so what you get at the end is:
All the neurons, classified along two different hierarchies, their morphologies, and their neurotransmitter type.
Their connection patterns at multiple levels of granularity. At a coarse level, the number of synapses between neurons (the weighted, signed directed adjacency matrix A, a sparse 140,000x140,000 matrix). At a granular level, the physical location of each synapse and the morphology of the connection.
What can you do with this? A guide to the FlyWire papers
With all of that under our belt, let’s go through the FlyWire papers listed in the Nature collection and see how they use this data. Note: I fed my sparse notes from reading these into Perplexity to fill in the gaps. I put two asteriaks ** next to papers that I think are of special interest to systems neuroscientists outside of the fly literature.
Studies involving just the FlyWire data and possibly other connectomes
**Neuronal wiring diagram of an adult brain
This foundational paper presents the complete connectome of an adult female Drosophila brain, comprising approximately 140,000 neurons and 54.5 million synapses. The authors analyze:
Cross-hemispheric connections, revealing how information flows between brain halves
Neuronal lineage assignments, providing insights into developmental origins
A specific circuit related to ocelli, light-sensitive organs on the fly's head that aid in flight stability
The paper serves as a comprehensive "what's inside" guide to the fly brain, laying the groundwork for future detailed analyses.
Whole-brain annotation and multi-connectome cell typing of Drosophila
This study compares the FlyWire connectome with the previously published hemibrain connectome to assess neuronal stereotypy across individuals. Key findings include:
Identification of 120 neuroblast lineages comprising 183 hemilineages, accounting for 88% of central brain neurons
Analysis of neuron morphology, projections, and neurotransmitter identity within hemilineages
Demonstration of overall stereotypy in cell types and strong connections, with some variations in weaker connections and specific brain regions (e.g., mushroom body)
This work provides crucial context for understanding the consistency and variability of neural circuits across individual flies.
Network statistics of the whole-brain connectome of Drosophila
Applying network science principles, this paper analyzes the connection patterns in the Drosophila brain. The authors examine:
Global network properties such as degree distribution and clustering coefficients
Recurring connectivity motifs and their prevalence in different brain regions
The relationship between network structure and neurotransmitter identity
This analysis offers insights into the organizational principles of the fly brain from a systems perspective.
Parts list and connections for a visual system
Focusing on the fly's visual system, this study provides a comprehensive catalog of neuronal types and their connectivity patterns in the optic lobe. The authors:
Identify and classify all intrinsic neurons in the optic lobe
Analyze connectivity rules governing different cell types
Explore how visual information is processed and relayed to higher brain centers
This detailed examination of the visual system serves as a model for understanding sensory processing in the fly brain.
**Predicting visual function by interpreting a neuronal wiring diagram
This study is dope! It uses connectome data to predict the receptive fields of various neuron subtypes in the visual system. Key aspects include:
Development of a CNN-like model based on synaptic connectivity
Prediction of neuronal function from structural data alone
Identification of function for previously unrecorded neurons
This work demonstrates how connectome data can be leveraged to generate testable hypotheses about neural function.

The fly connectome reveals a path to the effectome
Using a coarse-grained representation of the connectome (signed, weight adjacency matrix), this study applies linear dynamics analysis to understand information flow in the fly brain. The authors:
Derive eigenvalues and eigenvectors of neural activity assuming linear dynamics and short membrane time constants
Identify dominant modes of neural activity and their relationship to behavior
Propose a framework for linking connectome structure to behavioral outputs (the "effectome")
This theoretical approach provides a novel perspective on how brain structure relates to function at a systems level.
Diversity of visual inputs to Kenyon cells of the Drosophila mushroom body
This connectome-based study explores how visual information is encoded in the mushroom body, a brain region crucial for associative learning. The authors:
Map visual input pathways to Kenyon cells, complementing existing knowledge of olfactory inputs
Analyze the diversity and organization of visual inputs to different mushroom body compartments
Compare visual and olfactory coding strategies in the mushroom body
This work fills a significant gap in our understanding of multimodal sensory integration in the fly brain, with implications for learning and memory processes.
Studies involving supplementary experiments
Some other studies that were part of this collection augmented the pure FlyWire data with extra experiments.
Heterogeneity of synaptic connectivity in the fly visual system
This study focuses on the variability of synaptic connections in the Drosophila visual system, particularly in Tm9 cells. Key points include:
Documentation of higher connectivity variability in Tm9 cells compared to other cell types
Utilization of expansion microscopy to verify findings across multiple individuals
Implications for understanding the balance between stereotypy and variability in neural circuits
**A Drosophila computational brain model reveals sensorimotor processing
This paper is dope! It’s incredible that you can wire up a LIF model from the connectome data and it kind of works, even though, as we’ll see later, there’s a lot of missing information. It combines connectome-based simulations with experimental validation to explore sensorimotor processing in Drosophila. Highlights include:
Development of a leaky integrate-and-fire (LIF) model based on the connectome
Experimental verification of hypotheses generated by the computational model
Insights into how sensory information is transformed into motor outputs in the fly brain
Studies involving primary experiments with a side role for connectomics
Other studies in this collection used the FlyWire data as one sub-part of an analysis; the role for connectomics was more subdued. Here the connectome is an enabler rather than a primary driver.
Hue selectivity from recurrent circuitry in Drosophila
This experimental study uses connectome data to support its findings on color processing in the fly visual system. Key aspects include:
Primary focus on experimental investigation of hue selectivity
Utilization of connectome data to create a model explaining recurrent connections' role in shaping hue selectivity
Integration of functional and structural data to understand color processing mechanisms
Neural circuit mechanisms underlying context-specific halting in Drosophila
This research combines genetic screening with connectome analysis to investigate halting behavior in flies. Main points include:
Genetic driver screening to identify circuits involved in halting behavior
Confirmation of identified circuits using connectome data
Demonstration of how connectomics can complement traditional neuroscience approaches
Studies around the same time not using the connectomics data, but relevant nonetheless
Let’s not forget all the very good studies that came out around the same time that didn’t use the FlyWire data, but used other connectomics data to do some very good systems neuro.
**Mapping model units to visual neurons reveals population code for social behaviour
While not directly using the FlyWire connectome, this study is relevant to understanding visual processing in Drosophila. Key points:
Investigation of how visual information is encoded for social behavior
Use of computational models to map visual neurons to behavioral outputs
Insights into population coding in the fly visual system
This study is very cool–using virtualized environments to figure out what a fly must have seen at a particular point in time, and using that to analyze courting behavior.

**Connectome-constrained deep mechanistic networks predict neural responses across the fly visual system at single-neuron resolution
This preprint, though not part of the Nature collection, presents a relevant approach to integrating connectome data with functional predictions:
Development of deep mechanistic networks constrained by connectome data
Prediction of neural responses across the fly visual system at single-neuron resolution
Demonstration of how structural data can inform functional models of neural circuits

This story is very cool because it solves an obvious problem with uncalibrated connectomics information: you still don’t completely know the synaptic strength nor the intrinsic properties of the neurons. Using task-driven neural networks can partially fill this gap.
What did we learn?
It’s truly remarkable how much mileage we can get out of a complete map of a nervous system. There is information to be gleaned from just the map itself; other times, to really make headway into understanding a problem, more data (e.g. electrophysiology, behavior, transcriptome) needs to be collected. Sometimes the map is the key artifact to create a model. Other times, the map just becomes background information; it would have been possible, but a real pain, to get at the relevant information. In all cases, there is something special about having complete information in one domain: it advances the boundary of science.
Is that it?
It’s important to recognize that even with all that information, there remains a lot of missing information that would be highly relevant for a computational model of the fly nervous system. For instance:
The capacitance of the membrane (I learned in undergrad this was 1 uF/cm2, but apparently that can vary by a factor 2?! Wild.)
The strength of each synapse
The transfer function of each synapse
The density of receptors at each synapse
The density of ion channels as a function of the position across the membrane
That last one is particularly important to make good models of spike initiation. It’s recently been reported that spikes are initiated in fly neurons in a distal axon segment (DAS), an invertebrate analog of the axon initiation segment (AIS). There’s a high concentration of voltage-sensitive sodium channels (Para) in that segment, which is what allows spikes to start. But where’s the segment? It’s not as obvious as in vertebrates… it’s not next to the cell body!

So it’s clear that even with the morphology, the number of connections, their position, their “sign” (neurotransmitters), there are still many free parameters that would prevent us from emulating the fly brain 1:1.
Are we at the stamp collection stage of neuroscience?
For a long time, neuroscience has been driven in a hypothesis-driven way by a search for principles, motifs, patterns, and beauty. Optimality principles help us understand why things are the way they are, not just what they are or how they work. Yet, it must be the case that many features of the brain simply stem from evolutionary or developmental circumstances, which cannot be derived from first principles, so we must rely on direct measurement and mapping to understand them.
Thus, before we make pronouncements about why things are the way they are, we need to know what they are. We can work on this from two angles. In the first approach, we come up with some hypothesis about an unknown about a system, and we get data relevant to refuting or corroborating that hypothesis. A second approach is simply to document exhaustively what’s there in a richly annotated dataset (a “map”), which covers systems and hypotheses that we might not even have thought of beforehand. This is a lot more initial work, but then follow-up work is vastly accelerated.
The recent FlyWire work underscores the value of having a complete characterization of a system. While these efforts at large-scale mapping can sometimes be dismissed as mere “stamp collecting,” these projects are in fact crucial for laying the groundwork for hypothesis-driven research. Having a complete connectome can illuminate vital details that guide more targeted studies.
More connectomes or more maps?
Of course, connectomes do not address every question—especially in mammalian species where variability and plasticity are the norm. The success of FlyWire shows the promise of connectomics, but for different organisms and use cases, different types of maps are going to be relevant: spatial transcriptomic, functional maps, cell atlases can partially elucidate neural circuits in different organisms. It is up to us to make judgment calls about the most valuable maps, but my point is that maps are good.
One obvious challenge with this kind of bottom-up science is data volume. In Drosophila, the full network involves around 140,000 neurons. The many recent FlyWire publications capture only a fraction of what is there. Relying on manual, bottom-up approaches to digest this complexity becomes increasingly impractical. And that can feel agency-depleting for those of us who believe in the value of small, slow science: all trees, no forest.

Deciding what to study and characterize involves a mix of intuition, aesthetics, and pragmatism. We often focus on circuits like the compass system because they are aesthetically pleasing, relatively tractable and well-characterized, yet still hold unanswered questions. As data grows, human effort alone–grad students squinting at plot trying to see the forest through the trees–might not be enough. Freeing ourselves from our cognitive bottlenecks—say, our inability to hold information in our heads about the intricate connection patterns of hundreds of thousands of neurons—will likely become essential in detecting patterns and suggesting new directions for investigation. That’s the promise of AI agents, crawling the scientific literature and maps for new insights to be tested: renewing our commitment to hypothesis-driven science, supported by extensive mapping.
Ultimately, Drosophila studies highlight both the power of maps. By anchoring our thinking in robust, empirical data, we gain a sharper view of how evolution, development, and function intertwine to shape neural circuits.